

Structural Calm, Embedded Convexity
Macroeconomic Context
22–29 September 2025
Federal Reserve / Powell: Markets digested Powell’s remarks hinting at a “higher-for-longer” stance despite slowing growth. The Fed’s cautious tone maintained pressure on rates-sensitive assets.
J.P. Morgan Hedged Equity Roll: The quarterly collar roll (short call/long put spread) added incremental supply to downside vol while capping upside, a structural flow that influenced near-dated skew.
AI-driven Overvaluations: US tech valuations remain stretched, particularly in AI-linked equities, where implied multiples continue to price in long-dated growth that looks vulnerable in higher-rate regimes.
Mortgage & Debt Pressures: Mortgage delinquencies and consumer credit stress indicators ticked higher. This reinforces the embedded macro risk premium in the vol surface despite muted realised moves.
Global Risk Sentiment: Elevated geopolitical tensions and weaker EM currencies contributed to persistent demand for convexity, even as spot indices grind higher.
Strategy-Specific Observations
1. Market Maker Positioning
Near-term positioning has decayed materially, with little residual influence left from prior hedges.
Current positioning has largely decayed. The upper collar of JPM’s hedged equity fund sits at 6,505, but with expiry tomorrow that strike has already been discounted.
The key focus now is on tracking the flow into the new collar — tomorrow’s roll will determine the next relevant strikes and positioning dynamics.
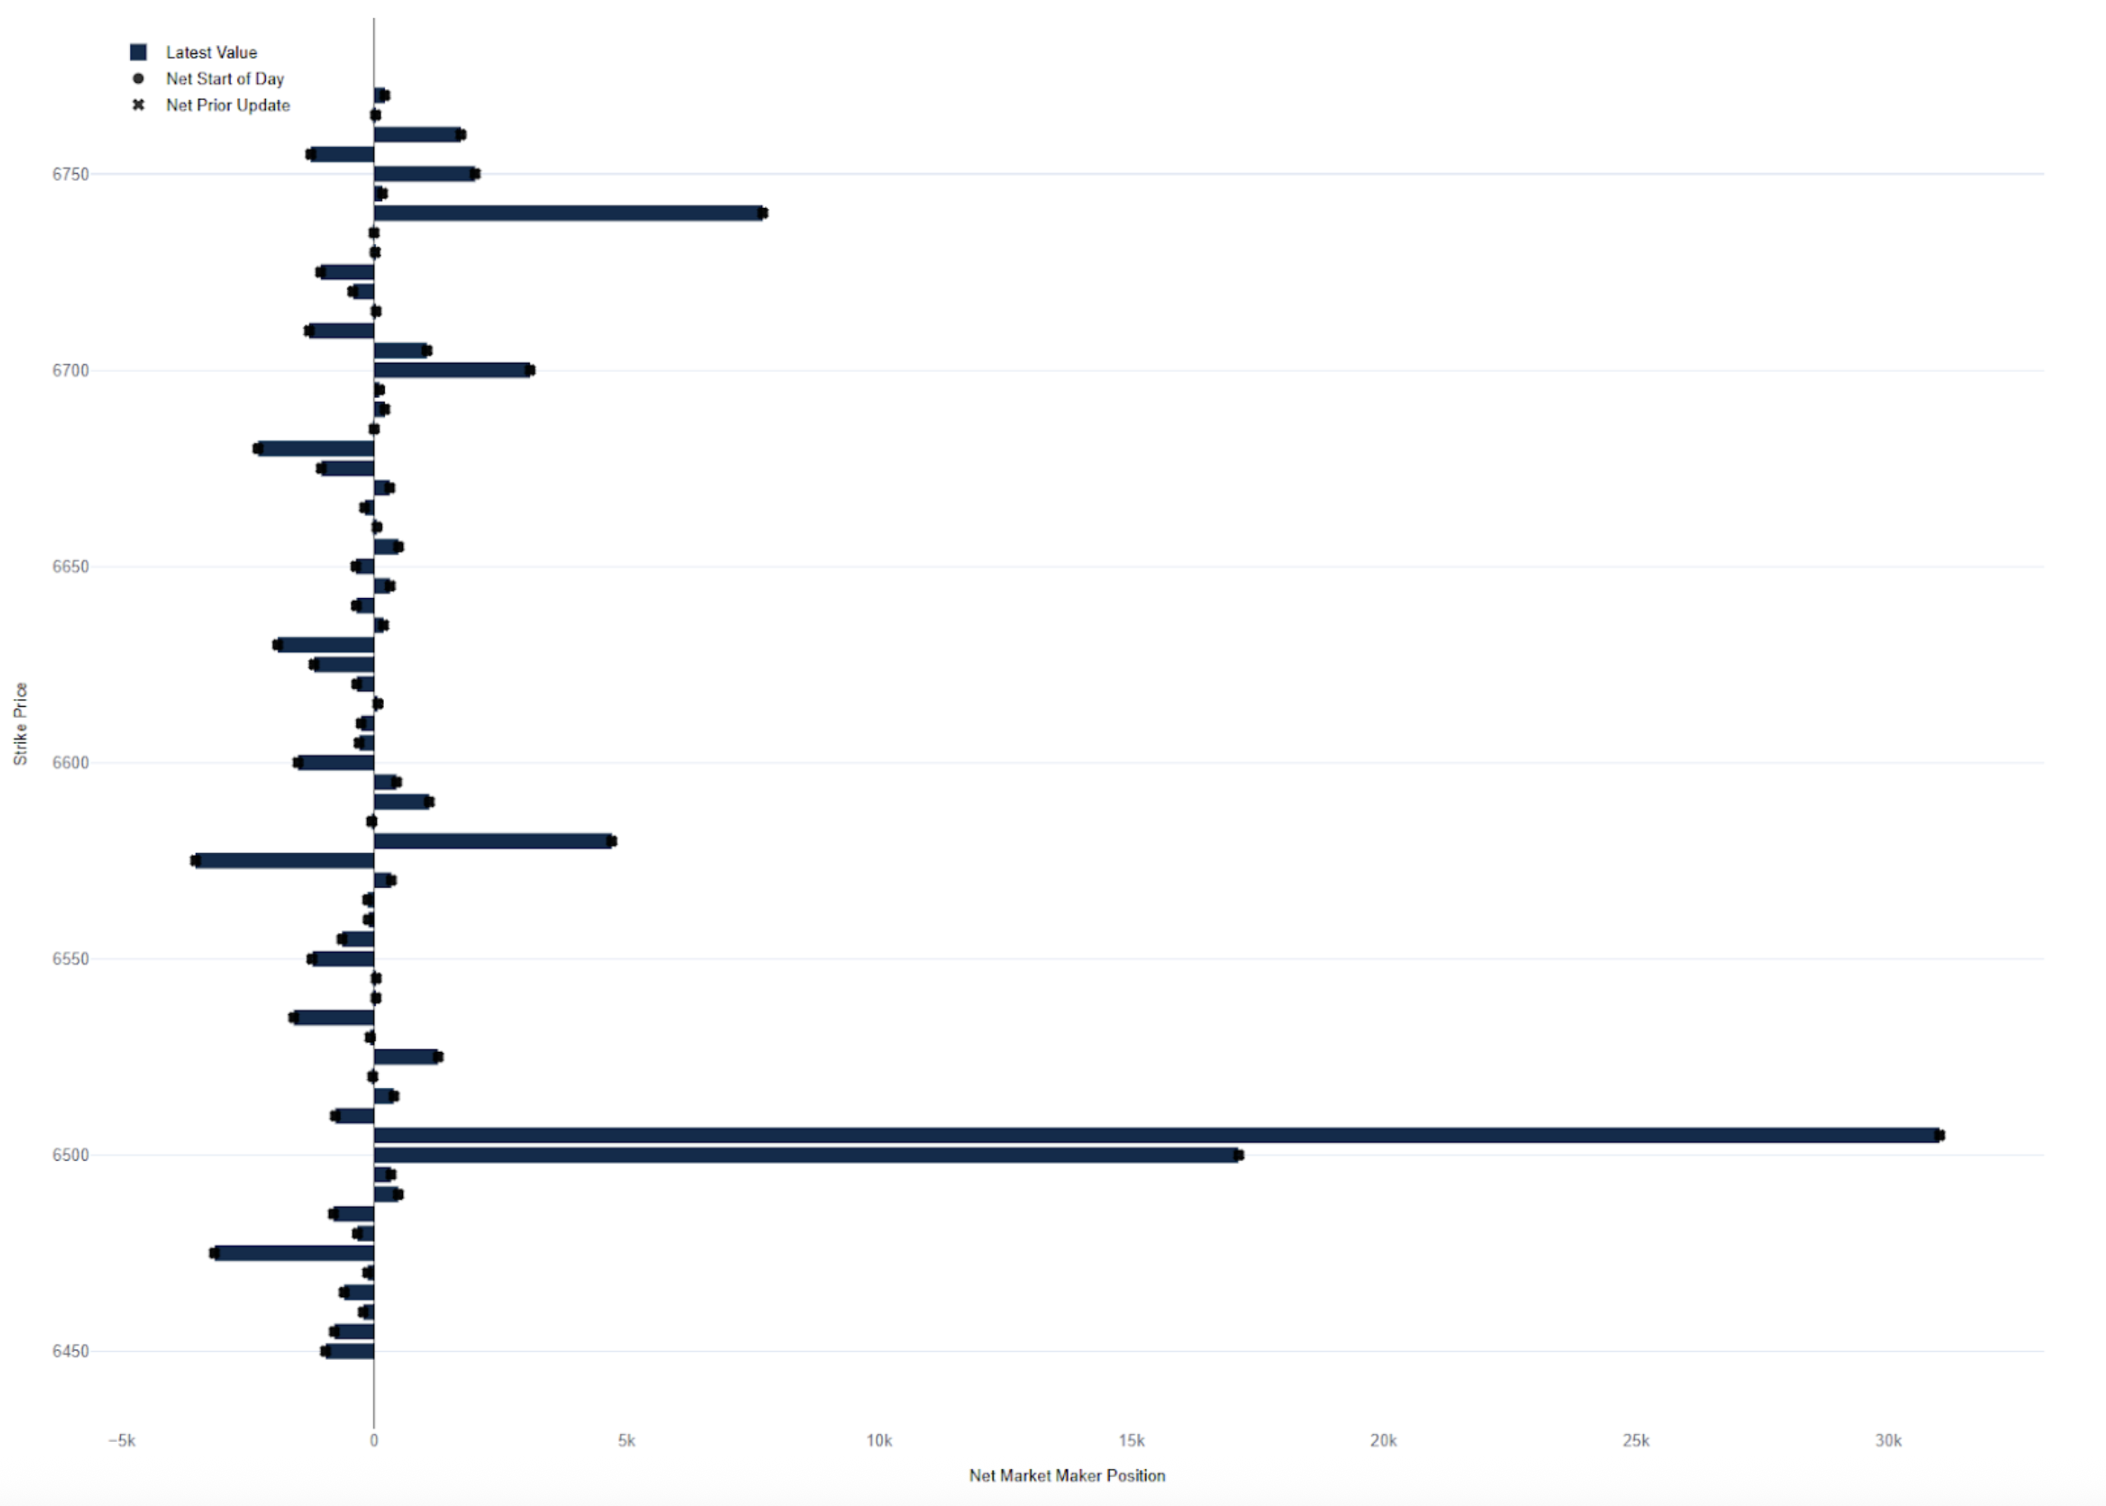
Graph 1 – Market Maker Positioning
2. Realised Volatility Term Structure
Short-term realised vol collapsed:
3-day: 7.26% | 38th percentile
10-day: 6.54% | 11th percentile
21-day: 7.33% | 9th percentile
Long-term vol remains sticky:
126-day: 23.21% | 83rd percentile
252-day: 19.20% | 67th percentile

Graph 2 – 1-Year Rolling Realised Volatility
Takeaway: Realised vol continues to compress but appears to have found a floor. While the VIX term structure remains in healthy contango, standalone vol or protection buying here does not make sense as a speculative trade. The beta and OLS measures in the following charts support this view.
3. Elasticity Estimates
63-day rolling elasticity remains deeply negative on OLS measures, indicating that the VIX/SPX relationship has weakened. This dynamic makes spot-up/vol-up scenarios increasingly plausible — an important shift for convexity-based positioning.
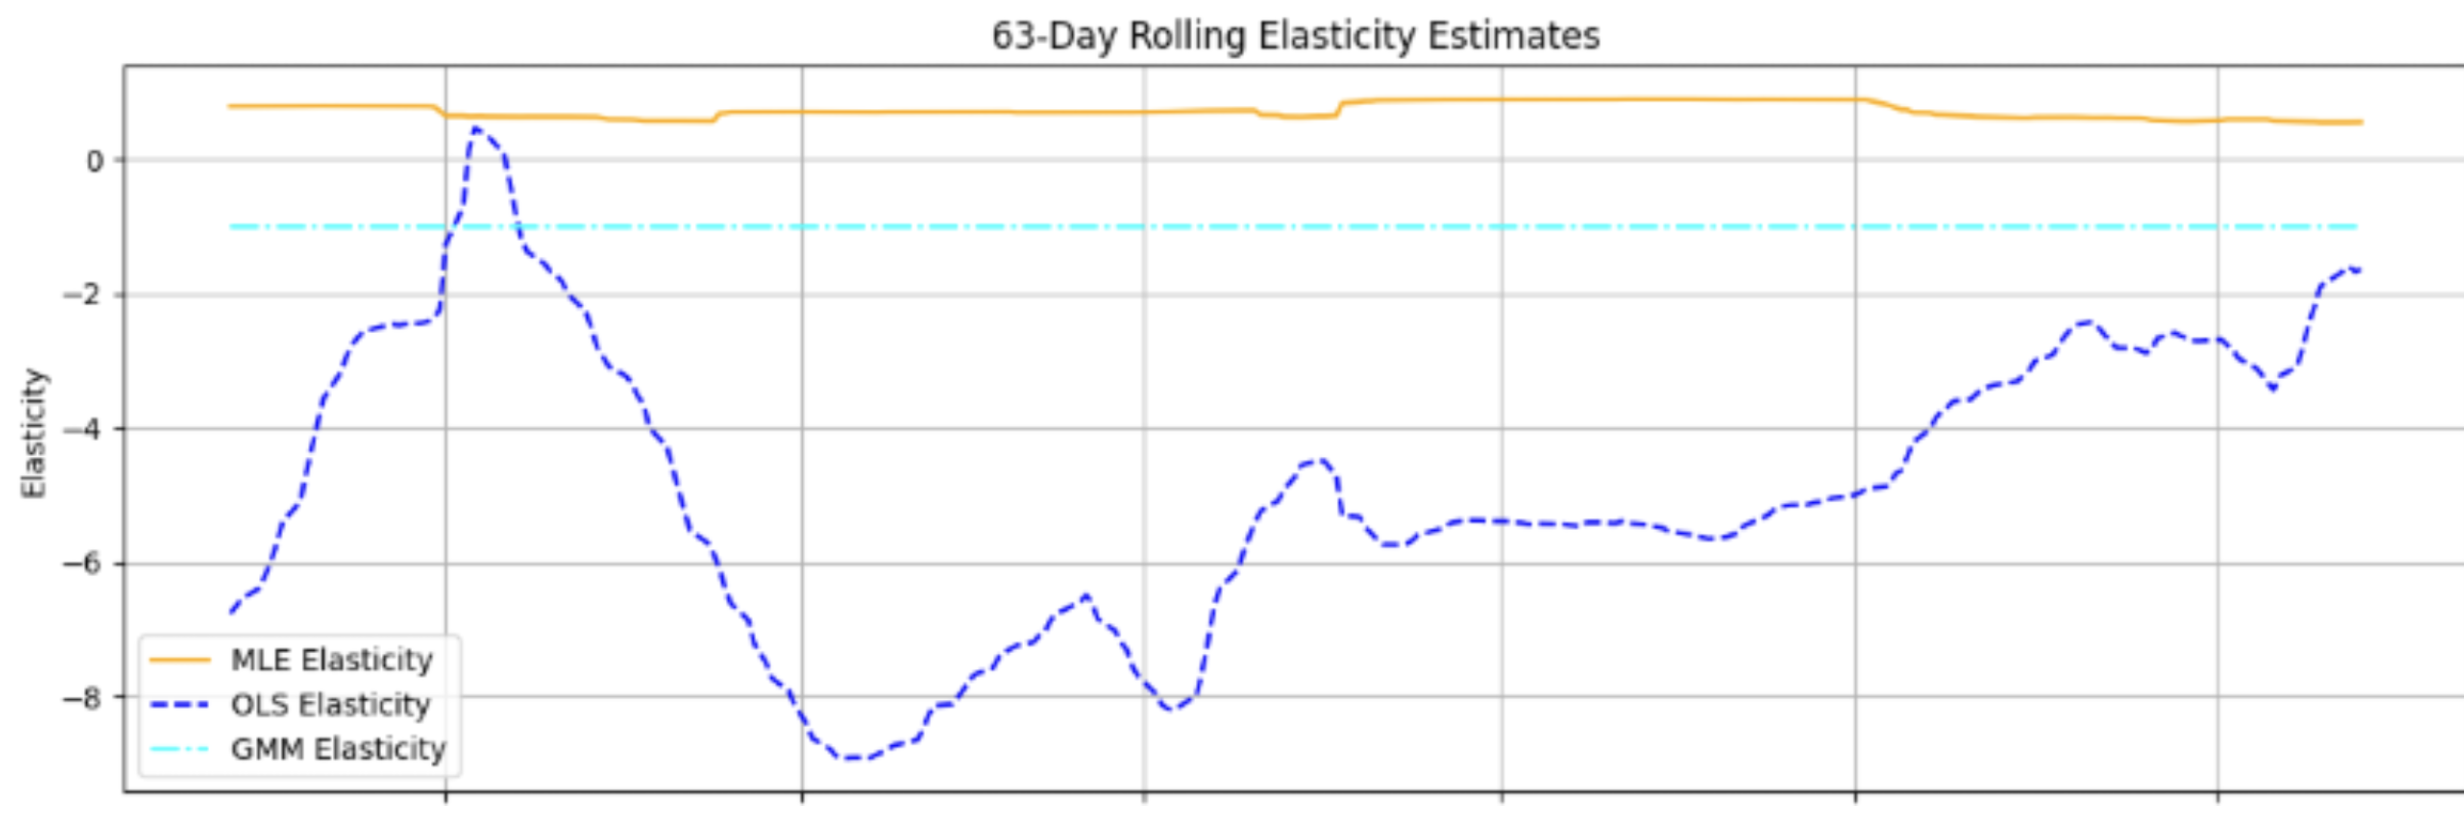
Graph 3 – 63-Day Rolling Elasticity Estimates
4. Skew & Risk Reversals
SPX skew remains extreme:
10D put skew: 94th percentile
25D put skew: 93rd percentile
25D risk reversal: 74th percentile
By contrast, VIX skew prints in the lower terciles (25D RR only 28th percentile).

Graph 4 – Fixed 3-Month Maturity Skew & Risk Reversals
Implication: Equity downside protection remains expensive.
5. Rolling Beta
The VIX–SPX beta has trended upwards since mid-May and more recently early September, suggesting that volatility may have found a floor.
At the same time, skew shows that downside protection remains expensive.
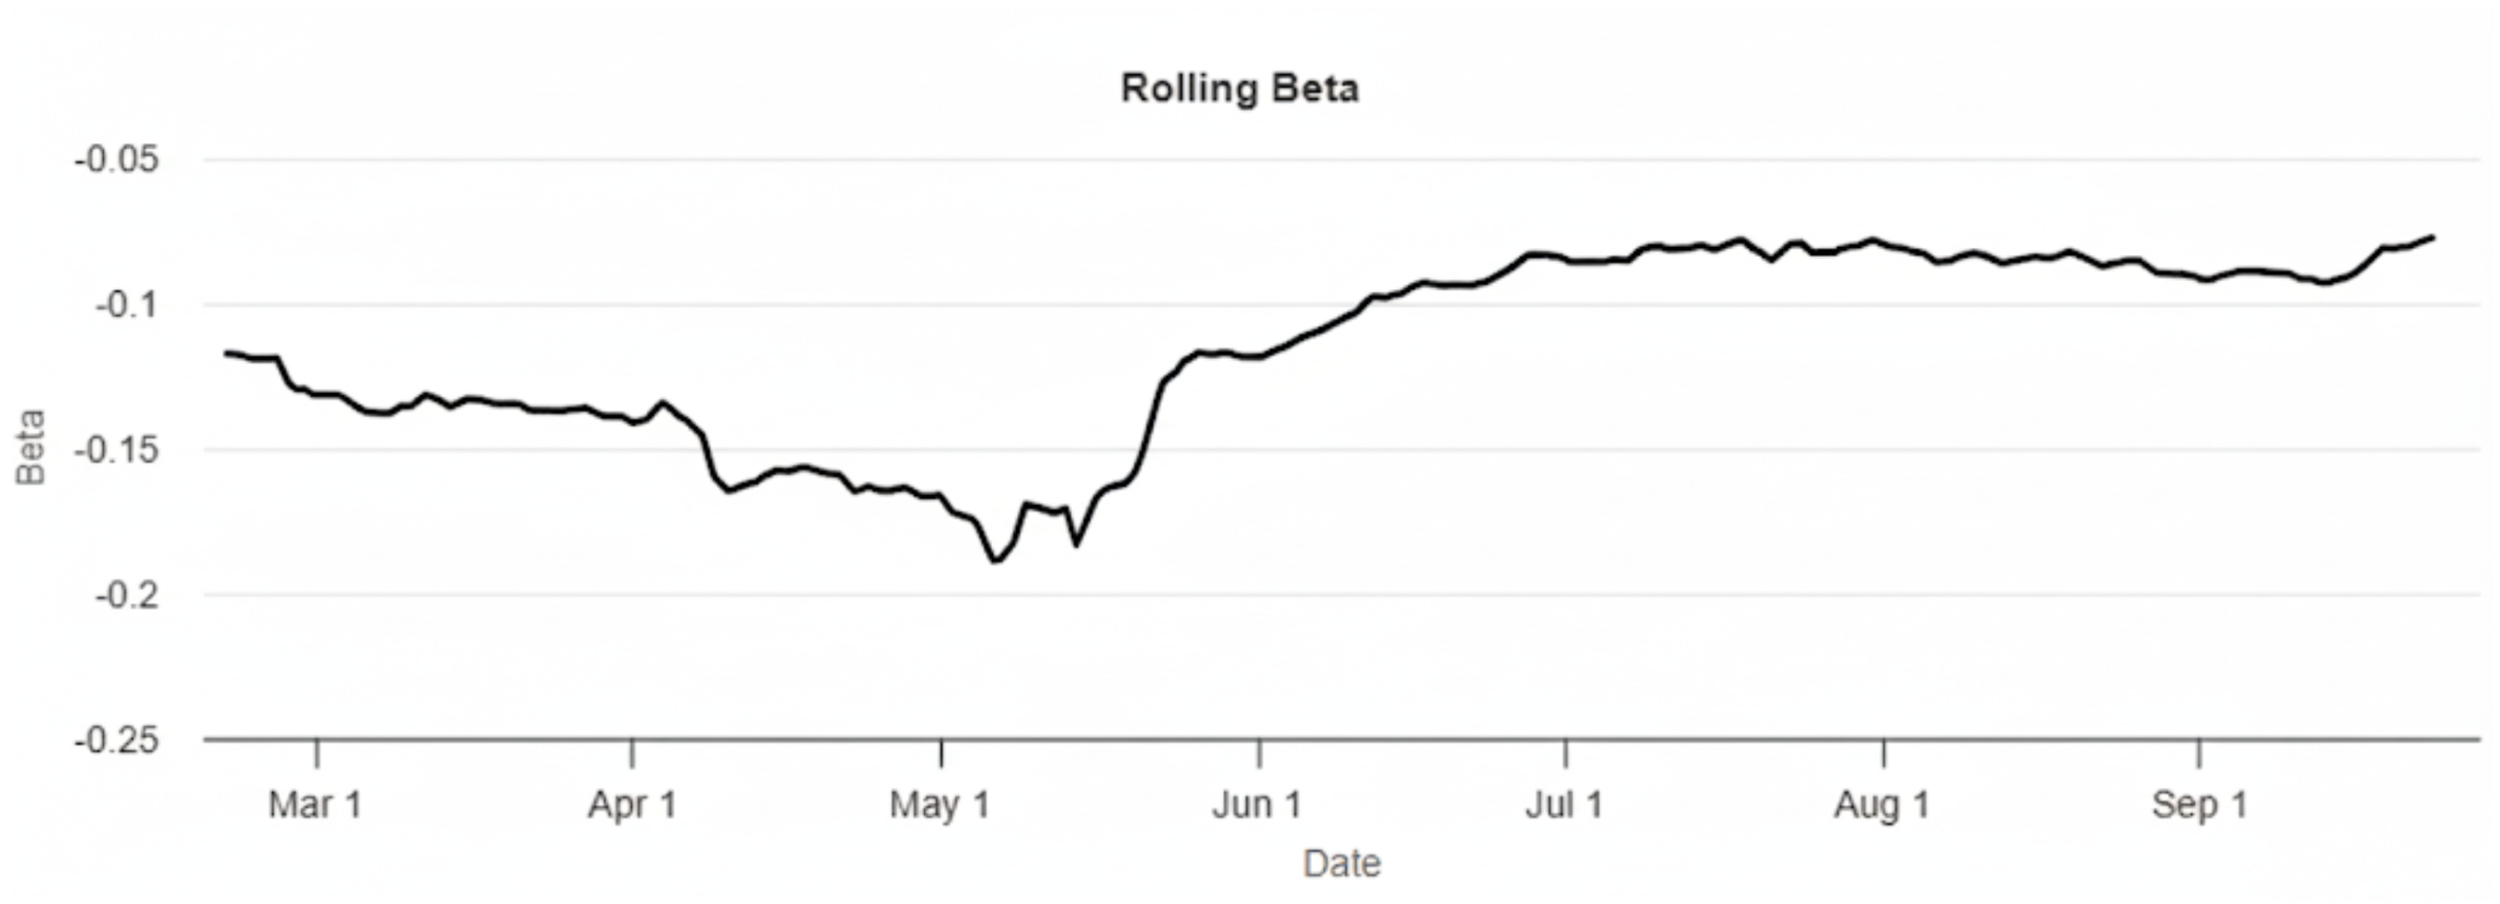
Graph 5 – Rolling Beta
Our take
If unhedged, it is more efficient to consider put spreads rather than outright naked puts (long 25 D puts short 10 D puts).